
Podcast measurement guide
Measure podcast social media performance without mixing metrics
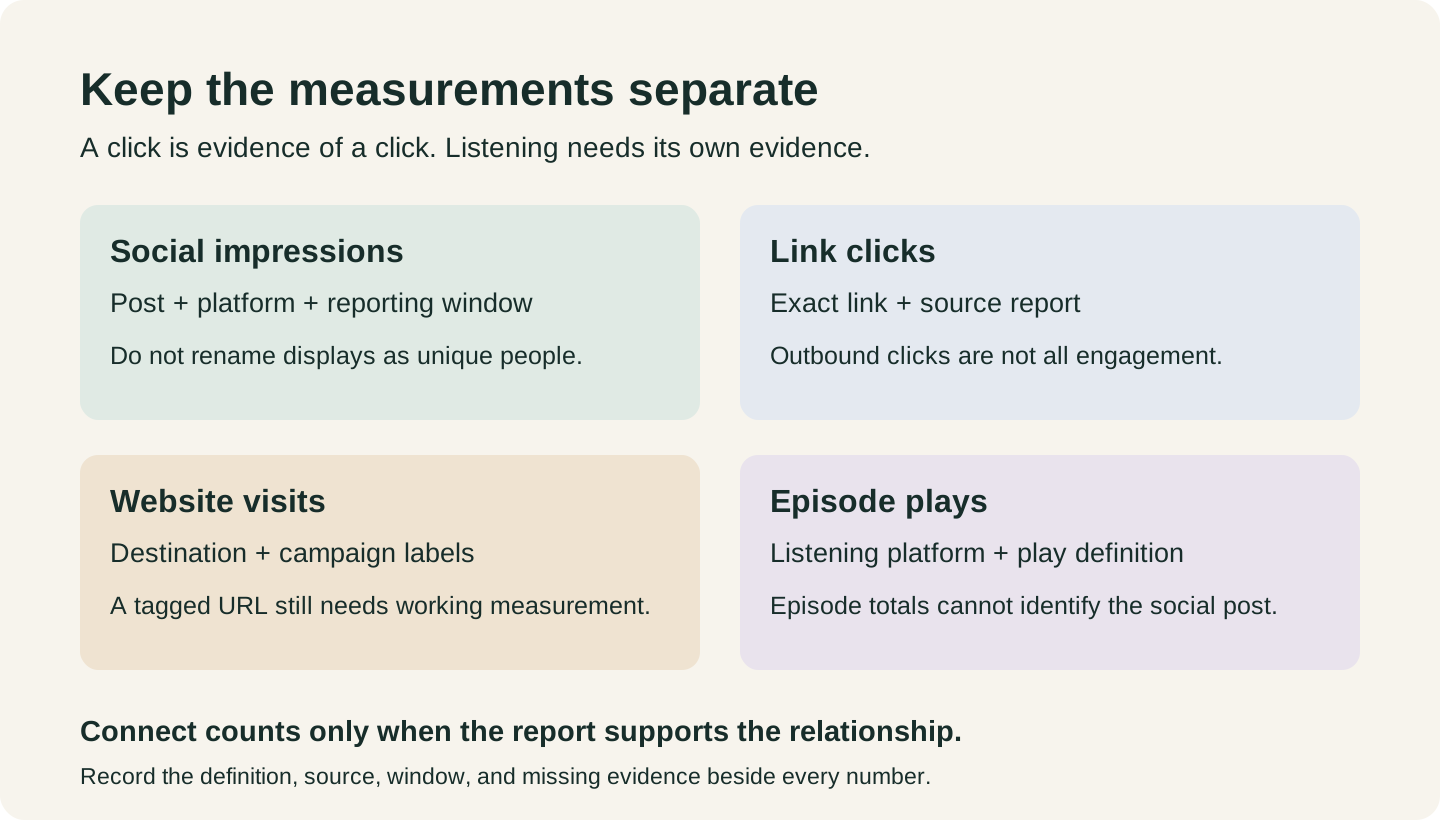
Measure podcast social media performance by choosing the action you want, then recording the metric that observes it. Keep social impressions, link clicks, website visits, and episode plays in separate fields. Only calculate a conversion rate when the report connects the numerator and denominator for the same link or asset, population, and time window.
A useful review ends with a decision: repeat a format, repair a link, wait for data, or change the question. The worksheet and fictional example below show how to reach that decision without treating every click as a listener or every missing value as zero.
Choose an outcome before choosing a chart
If the job is to send readers to the episode page, track the link and the destination report. If the job is listening, use the listening platform’s defined play metric where available. If the job is discussion, review relevant responses. A post can complete one job without completing the others.
| Question | Evidence to save | Boundary to retain |
|---|---|---|
| Did the post get seen? | The social platform’s named impression or reach metric, scope, and export. | Do not rename impressions as unique people or compare them with a different platform’s video-view definition. |
| Did people follow the invitation? | Outbound-link clicks or destination visits, with the exact link and reporting source. | A general engagement count may include actions other than an outbound click. |
| Did the episode get played? | The listening platform’s play report; use share-link reporting if it supports the link you used. | Episode-wide plays alone do not identify which social asset brought them. |
| Did the message start a useful discussion? | Responses relevant to the intended question, reviewed in context. | A small set of replies does not describe the whole audience. |
Keep platform definitions beside the numbers
Spotify defines a play as an episode being watched or listened to for at least 30 seconds on Spotify. That threshold describes Spotify plays, not every podcast host’s download or every social platform’s video view. Source: Spotify analytics glossary.
Spotify’s Discovery report separates discovery inside Spotify from links shared through Spotify for Creators. The Sharing section reports link clicks, plays, and a click-to-play conversion rate. Use the specified share link and the report’s own scope; do not recreate that rate by dividing all episode plays by unrelated social clicks. Source: Spotify Discovery and Sharing analytics.
Record the metric label, definition, time zone, selected interval, and export time. If the service does not disclose a detail, write unknown. Different reports can refresh at different times, so a recent missing result may need another check rather than a zero.
Choose between a tagged website link and a platform share link
For a website whose reporting you can inspect, campaign parameters can distinguish where traffic came from and which asset carried the link. Google documents source, medium, campaign, and content parameters, with content used to distinguish creatives. The website must already record and report these campaign labels; adding a query string does not create a report by itself. Source: Google campaign URL documentation.
For a direct Spotify destination, inspect Spotify for Creators’ share-link workflow and Sharing report instead of assuming a website UTM report follows the person into Spotify. Confirm that the account and link you use expose the needed data. Keep the exact generated link in the worksheet. Source: Spotify share links and Sharing report.
Example naming for an owned episode page: utm_source=linkedin, utm_medium=social, utm_campaign=episode_workflow, utm_content=text_a. A second creative can use clip_b as its content value. The parameter list is an illustrative naming record, not a functioning tracking link. Keep spelling and capitalization consistent, and test the real destination before publishing. Source: Google parameter names and case sensitivity.
Copyable report
Podcast social performance review record
Keep a row per asset. Blank means unfinished; use not observed or not available when that is the actual evidence state.
Episode and public episode URL: [ ]
Review question and desired reader action: [ ]
Asset ID, format, platform, and public post URL: [ ]
Post published at and named time zone: [ ]
Observation window, report time zone, and export time: [ ]
Organic or paid distribution; other promotion during the window: [ ]
Exact shared URL and campaign/content labels, if used: [ ]
Metric name, definition, and source report: [ ]
Count and evidence state: [observed / not available / not observed]
Comparable denominator and its source: [or not available]
Listening result linked to this asset by the report: [or not available]
Link or data-quality issue: [ ]
Decision and evidence that could change it: [ ]
Next review owner and date: [ ]
Measurement method
Build a report that can support a decision
Write a decision you could act on
Choose a specific question, such as whether a text recommendation or a clip gets more visits to the episode page. Define the required output before posting. Do not switch from a listening goal to likes after seeing a flattering number.
Keep the asset and destination identifiable
Save the post URL, exact shared link, source episode, and asset label. Open the link through its redirects and confirm the intended destination. A naming convention is useful only if the published URL and the report preserve it. Source: Google campaign parameter guidance.
Use comparable windows and preserve exports
Compare assets at a similar age after publication, on the same platform and distribution basis where possible. Save the selected dates, time zone, and export time. Note paid boosts, guest reshares, and episode-release activity instead of treating those differences as a format effect.
Calculate only rates with compatible inputs
For a single post and window, outbound-link clicks divided by that post’s impressions can describe a click-to-impression ratio if both counts are available and defined. Label it that way. It is not a unique-person conversion rate or a listening rate. If either count is unavailable, leave the ratio unavailable. If impressions are zero, the ratio is undefined; show the counts without a percentage.
Choose the next check, not a universal winner
Keep the supporting report beside the decision. Repeat a promising setup to check whether the pattern holds, repair a broken destination, or wait for an incomplete export. Do not call one uncontrolled comparison an experiment that proved a format causes better listening.
Worked report
A clip has fewer clicks, but the same ratio
The following numbers are invented for teaching. A text post and a clip promote the same hypothetical episode on the same unspecified social platform. Each is measured over its own first seven complete days; both are organic and use the same destination. No real campaign was run.
| Asset and reporting window | Observed in the fictional export | Supported interpretation |
|---|---|---|
| Text A | 1,000 impressions; 30 outbound-link clicks; 22 tagged website sessions. | 30 ÷ 1,000 = 3% click-to-impression ratio. The website sessions are a separate report, not a count of confirmed listeners. Source: the synthetic worksheet in this guide; not observed campaign data. |
| Clip B | 800 impressions; 24 outbound-link clicks; 18 tagged website sessions. | 24 ÷ 800 = 3%. The smaller click total does not establish a worse click-to-impression ratio. Source: the synthetic worksheet in this guide; not observed campaign data. |
| Guest reshare C | Impressions and outbound clicks not available to the editor. | Leave its ratio unavailable. Do not enter zero or include it in a combined average. |
| Episode-wide Spotify report | 90 plays during the calendar reporting period; no asset-linked listening report saved. | Record the 90 plays separately. The episode-wide total cannot supply a play numerator for A or B. |
A complete review memo you can adapt
“A and B each recorded a 3% click-to-impression ratio in this fictional comparison. A produced more clicks, while B had fewer impressions. We cannot decide which asset generated more listening because the saved episode report does not link plays to either asset. For the next review, keep the visit goal and compare another matched observation window, or obtain the relevant share-link listening report if listening is the goal. Exclude C from the rate calculation until comparable data is available. Source: the synthetic worksheet in this guide; not observed campaign data.”Illustrative editorial review memo — not campaign results
A simple average of the two percentages happens to match the combined ratio here. For compatible post counts, compute the combined ratio from totals: (30 + 24) ÷ (1,000 + 800) = 3%. Do not average arbitrary rates from different definitions or include an unavailable count as zero. Source: arithmetic on the synthetic worksheet, not a platform benchmark.
The difference between social clicks and website sessions does not identify specific people who dropped out. The reports measure different events. Investigate reporting setup and definitions if the difference matters; do not assign a cause from these totals alone.
The report supports a limited observation about clicks, followed by a choice of what to measure next. It does not rank all text posts against all clips, and it does not justify a claim of additional listeners caused by either asset.
Keep the decision as narrow as the evidence. A useful next step can be to repair measurement rather than publish more of the apparent winner.
Compare how the approved core changes in the LinkedIn workflow and the X workflow.
Decision review
What should happen next?
| Observation | Next action | Conclusion to avoid |
|---|---|---|
| Clicks are available; listening is not linked. | Report clicks and visits as such. Obtain a relevant listening report if that is the goal. | Every click became a listener. |
| Destination or campaign label is wrong. | Repair the published link where possible, record the change time, and keep before/after windows separate. | The post format failed. |
| The export is incomplete or still refreshing. | Record pending and revisit after the service’s reported refresh interval. | Zero people responded. |
| A guest or paid boost changed distribution. | Record that context and compare like-for-like subsets when available. | The wording alone caused the increase. |
- The report names one decision and one intended reader action.
- Every count has a metric definition, source, window, and evidence state.
- Rates use compatible numerators and denominators; missing is not zero.
- The decision separates observed attribution from a claim about causation.
- The next review says what additional evidence could change the decision.
Measurement boundaries
What this report cannot prove
- The worked report contains synthetic teaching data, not PodInk traffic, a customer campaign, or a vendor benchmark. No social post, tracking link, or experiment was launched for this guide.
- Platform counts can describe events rather than distinct people. Preserve the metric definition instead of adding audiences across services.
- A tagged URL does not install analytics or prove that a person played an episode. Verify the reporting available at the destination you control.
- Reported attribution and causal impact are different. A post-associated play does not by itself show that the play would not have happened without that post.
- PodInk prepares source-grounded writing; this guide does not claim a built-in social analytics dashboard, automatic campaign tracking, or scheduled publishing.
Human review remains necessary. No repurposing workflow can turn weak evidence into a strong claim.
FAQ
Frequently asked questions
Do podcast social media clicks equal listens?
No. A click records an interaction with a link. A listening report applies its own play definition. Use a report that supports the link-to-play relationship rather than joining unrelated totals.
Can I use UTM parameters without buying another tool?
You can create campaign labels manually and keep a spreadsheet, but usable visit reporting still requires a compatible measurement setup at the destination. Check what your existing services actually record before buying or connecting anything.
Should I combine results across platforms?
Keep platform-level results separate first. Combine counts only when definitions, scope, and windows support it, and label the result as events rather than a deduplicated audience unless deduplication is actually established.
What if the report has no data for one post?
Distinguish an observed zero from unavailable access, a pending refresh, or a check you have not run. Keep the reason beside the asset and exclude an unavailable denominator from rate calculations.
Evidence
Sources and comparison pages
- Understanding Discovery analyticsSpotify for Creators
- Analytics glossarySpotify for Creators
- URL builders: Collect campaign data with custom URLsGoogle Analytics Help